Menu Engineering for Canadian Restaurants: The Complete Guide to Stars, Plowhorses, Puzzles, and Dogs
The complete, definitive guide to menu engineering for Canadian restaurants. Includes formulas, KPIs, a cheat sheet, trends from 2025-2027, and specific strategies for QSR, takeout, full-service, cafés, and liquor-primary establishments.
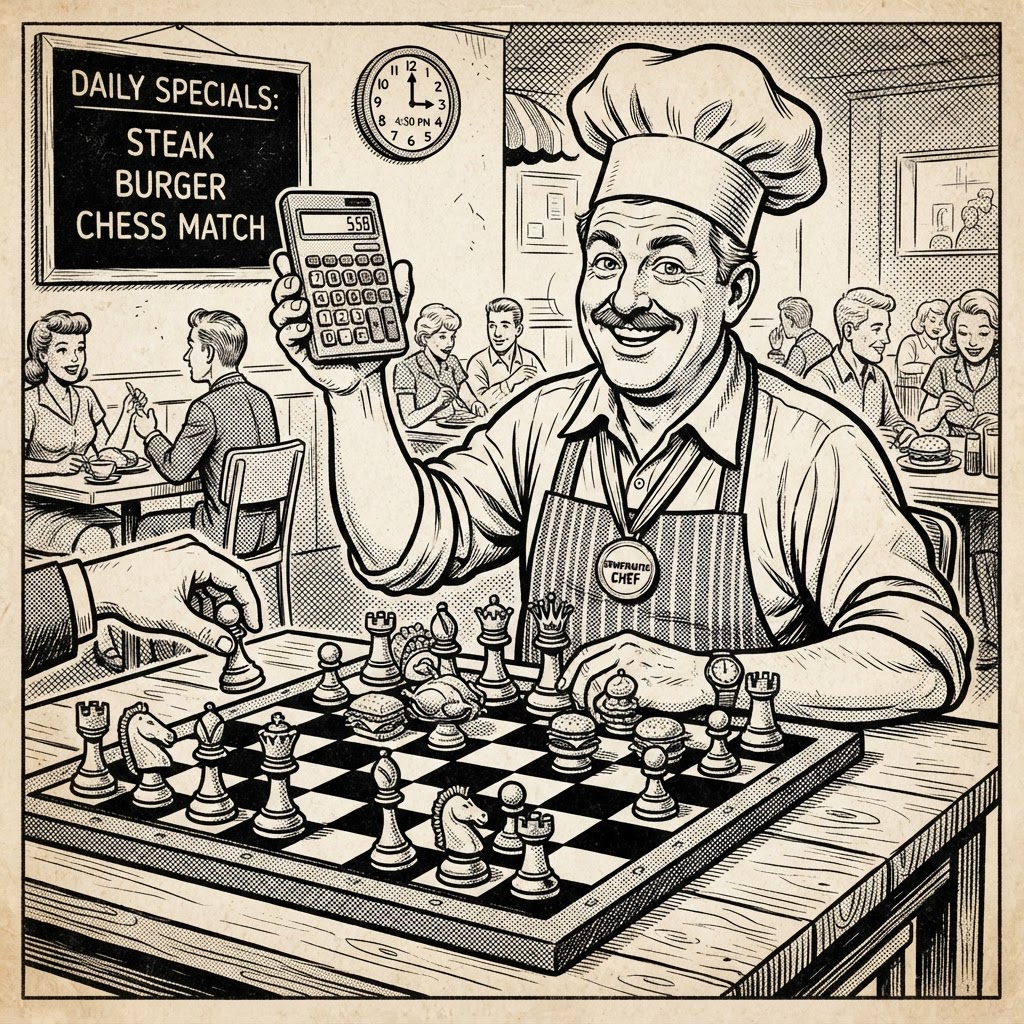
Menu engineering is the closest thing restaurant operators have to a superpower. You don't need new equipment, new staff, or a renovation. You need a calculator, your POS data, and the willingness to look at your menu honestly. A Cornell University study found that restaurants that ran menu engineering properly added 10-15% to their profit — without changing a single recipe.
In 2026, with food costs up 40%+ since 2019, 91% of Canadian operators citing food cost pressure, and 4,000 restaurants projected to close, menu engineering isn't a luxury. It's survival.
This is the complete, definitive guide — formulas, KPIs, a cheat sheet, trends from 2025 through 2027, and specific strategies for every type of establishment.
The Core Principle: Two Numbers, Four Outcomes
Menu engineering evaluates every dish by two metrics: profitability (contribution margin in dollars) and popularity (how often it's ordered). Plot these on a 2×2 matrix.
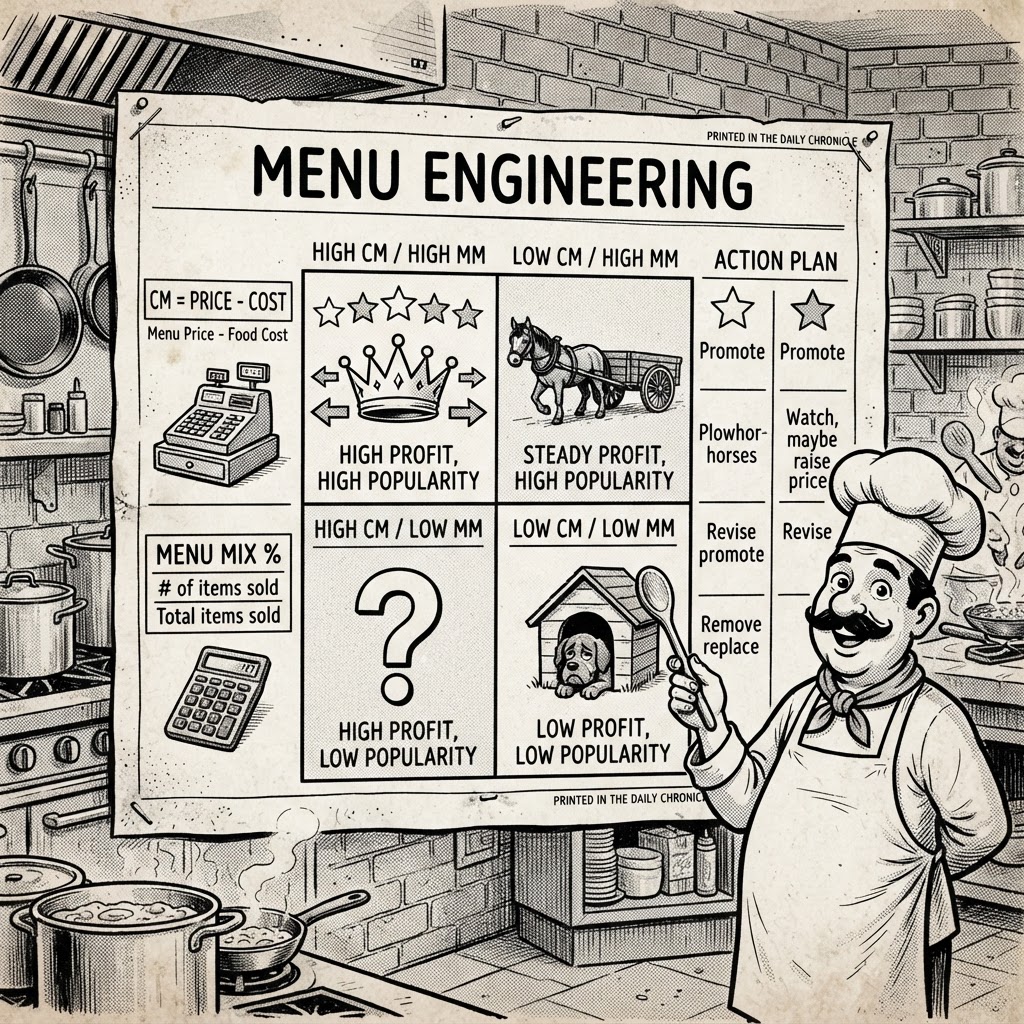
⭐ Stars — High Profit + High Popularity
Action: Feature prominently (top-right of menu). Protect the recipe. Don't raise prices aggressively. Train servers to recommend.
🐴 Plowhorses — Low Profit + High Popularity
Action: Don't remove — customers would revolt. Raise price $1-2, reduce portion 10-15%, or find cheaper suppliers. A $1 increase × 300 units/month = $300/month pure profit.
🧩 Puzzles — High Profit + Low Popularity
Action: Move to prime menu position. Rewrite description (Cornell: descriptive labels boost sales 27%). Train servers to upsell. Feature as specials.
🐶 Dogs — Low Profit + Low Popularity
Action: Remove. Every Dog wastes inventory, slows the kitchen, and occupies space a Star could fill.
The Complete Formula Guide
Formula 1: Contribution Margin
CM = Menu Price − Food Cost
Example: $21.95 butter chicken − $6.50 food cost = $15.45 CM
Critical: Menu engineering uses CM in DOLLARS, not food cost %. A $40 steak with 38% food cost has $24.80 CM. A $16 pasta with 25% food cost has $12.00 CM. The pasta has better food cost % — but the steak puts twice as many dollars in your pocket.
Formula 2: Menu Mix %
(Units Sold of Item ÷ Total Units Sold) × 100
Example: 310 ribeyes ÷ 3,495 total × 100 = 8.9%
Formula 3: Popularity Threshold
(1 ÷ Number of Menu Items) × 0.70
Example: 24 items → (1 ÷ 24) × 0.70 = 2.92%. Items above 2.92% = high popularity.
Formula 4: Profitability Threshold
Total CM ÷ Number of Items Sold = Average CM
Items above average = high profit. Below = low profit.
Formula 5: CM Achievement Rate
Total CM ÷ Total Menu Mix
A rate above 1.0 means your menu is performing above average.
Key Performance Indicators (KPIs)
| KPI | Formula | Target |
|---|---|---|
| Food Cost % | COGS ÷ Food Sales × 100 | 25-35% |
| Contribution Margin | Price − Food Cost | Above avg |
| Menu Mix % | Units ÷ Total Units × 100 | Above threshold |
| Average Check | Total Sales ÷ Covers | Rising MoM |
| Prime Cost % | (Food + Labour) ÷ Sales × 100 | 55-65% |
| SPLH | Sales ÷ Labour Hours | $120-180 |
| Star Ratio | Stars ÷ Total Items | 20-30% |
| Dog Ratio | Dogs ÷ Total Items | Under 15% |
The Cheat Sheet
| Category | Profit | Popularity | Strategy | Pricing |
|---|---|---|---|---|
| ⭐ Star | High | High | Feature, protect, promote | Hold or small increase |
| 🐴 Plowhorse | Low | High | Reprice, reduce portion, cheaper suppliers | +$1-2 |
| 🧩 Puzzle | High | Low | Reposition, rewrite, train servers | Hold or slight decrease |
| 🐶 Dog | Low | Low | Remove from menu | N/A |
Menu Engineering by Establishment Type
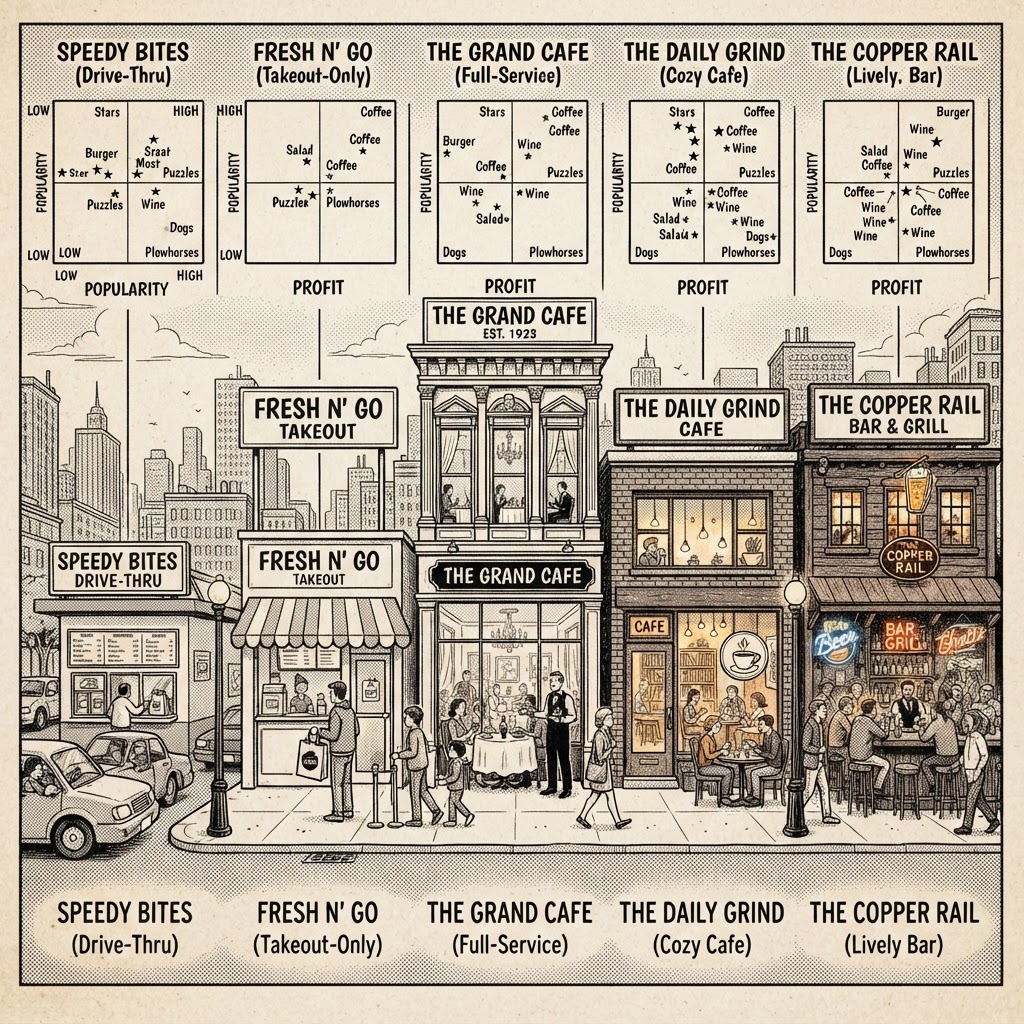
1. Quick-Service Restaurants (QSR)
Benchmarks: Food Cost 25-30% | Menu Size 10-15 items | Avg Check $12-18
Focus: Speed and consistency rule — every item must be executable in under 4 minutes. Combos and value meals are your Plowhorses. Use digital menu boards to dynamically feature Stars during peak hours. In 2026, QSR demand is channel-specific (drive-thru vs. takeout vs. delivery) — analyze menu mix by channel, not just overall (QSR Magazine, RestoLabs).
2. Takeout-Only / Ghost Kitchens
Benchmarks: Food Cost 25-32% | Menu Size 8-12 items | Packaging 5-8% of item price
Focus: Packaging cost must be included in your CM calculation. Travel-stability matters — items that arrive soggy kill repeat orders. Keep menus tiny (8-12 items). Every item should share ingredients to minimize inventory. Photos on delivery apps are your menu design — invest in professional photography for Stars and Puzzles.
3. Full-Service Restaurants (FSR)
Benchmarks: Food Cost 28-35% | Menu Size 20-25 items | Avg Check $25-35+
Focus: The golden triangle (top-right, top-left, center) is critical — place Stars there. Beverages are now the largest growth engine (49.5% category share, FSR Magazine 2026). Engineer beverage menus with the same rigor as food. Train servers to recommend Puzzles — server suggestion is the #1 driver of puzzle-to-star conversion. Use decoy pricing. Quarterly engineering is non-negotiable.
4. Cafés and Bakeries
Benchmarks: Beverage Cost 18-25% | Food Cost 25-30% | Menu Size 15-20 items
Focus: Beverages are your Stars — coffee has 18-25% cost and 75-82% CM. Food items are typically Plowhorses or Puzzles. In 2026, premium coffee is getting the upgrade and cold brew is becoming a premium item (Toast 2026). Engineer coffee and food menus separately. The add-on strategy is critical: "Would you like a pastry with that?" lifts average check by $3-4.
5. Liquor-Primary (Bars, Pubs)
Benchmarks: Beverage Cost 18-24% | Food Cost 30-35% | Pour Cost 18-22%
Focus: Beverages are overwhelmingly your Stars. Food is often a Plowhorse designed to keep patrons drinking. Engineer liquor using pour cost (cost of alcohol per drink ÷ menu price). Zero/low-proof beverages are the fastest-growing category (FSR Magazine, 2026). Happy hour specials are typically Plowhorses. Engineer by daypart — different Stars at lunch vs. dinner vs. late night. Provincial liquor pricing (LCBO, SAQ) makes Canadian bar engineering unique.
Industry Trends: 2025 → 2026 → 2027
2025: The Year of Cost Pressure
- 43% of operators planned to increase menu prices if COGS rose (Toast)
- 35% were actively running profitability analysis
- Plant-based menu items proliferated (Modern Restaurant Management)
- US median burger price reached $14.48 (Circana/Restaurant Business)
2026: The Year of the Trimmed Menu
- Menus getting smaller — streamlining to reduce waste and complexity (RestoBiz)
- Digital menu boards update dynamically based on guest behavior (Prepared Foods)
- AI-powered menu engineering entering mainstream (Restaurant Dive)
- Master Restaurant Index: 4.7 margin points hidden in unanalyzed menus
- Beverages now 49.5% of category share (FSR Magazine)
- InterMenu: digital analytics (view-to-order ratios) now inform engineering
2027 Predictions: AI, Hyperpersonalization, Automation
- AI menu optimization moves to mainstream — continuous analysis replacing quarterly manual reviews (McKinsey, 2026)
- Hyperpersonalized menus — gen AI suggesting items based on individual preferences
- Agentic AI could enable customer AI agents interacting directly with restaurant systems
- Dynamic pricing — menu prices adjusting based on demand, time, and inventory
- Continuous engineering — real-time data from digital menus feeding automated analysis
- Sustainability-driven engineering — carbon footprint and zero-waste goals influencing menu decisions
Canadian vs. American Landscape
| Factor | Canada | United States |
|---|---|---|
| Food cost pressure | 91% cite as #1 (Restaurants Canada) | High but slightly lower inflation |
| Menu trimming | Accelerating — 4,000 closures | Present but less urgent |
| Tech adoption | Slower — many on spreadsheets | Faster — POS analytics common |
| Tax complexity | GST/PST/HST by province | Sales tax by state |
| Beverage opportunity | LCBO changes opening channels | More fragmented distribution |
The 6-Step Process
Step 1: Pull 30 days of POS data — item name, units sold, price, food cost per item.
Step 2: Calculate CM for every item. CM = Price − Food Cost. Use dollars.
Step 3: Calculate Menu Mix %. (Units ÷ Total Units) × 100.
Step 4: Determine thresholds. Popularity = (1 ÷ items) × 0.70. Profitability = average CM.
Step 5: Plot the 2×2 matrix. Place every item.
Step 6: Take action. Stars → feature. Plowhorses → reprice. Puzzles → reposition. Dogs → remove.
Cadence: Quarterly full analysis. Monthly quick check. Seasonally rotate. Annually redesign.
The Bottom Line
Your menu is the most important financial document in your restaurant. Every item is either making you money or costing you money. Menu engineering takes 2-3 hours the first time, 30-60 minutes quarterly after that — and the payoff is a 10-15% profit increase backed by Cornell University research.
In 2026's economy, the operators who survive will be the ones who know their numbers to the decimal point.
Foodie Run calculates contribution margins, tracks menu item profitability, and shows you which items are Stars, Plowhorses, Puzzles, and Dogs — automatically. Built in Canada. $19.99/month.
🎁 Start a free 14-day trial — no credit card required. Use code MANAGE25 for 25% off.
Sources: Cornell University, Michigan State University, Toast 2026, McKinsey (2026), Modern Restaurant Management, Prepared Foods, InterMenu, Master Restaurant Index, FSR Magazine, Restaurant Dive, Circana/Restaurant Business, Restaurants Canada, Dalhousie University.
Take control of your restaurant's numbers
Foodie Run brings prime cost, labour, forecasting, and reporting into one Canadian-built platform.
Start your 14-day free trial
