A research-based formula for independent operators — market data, cost benchmarks, a Balanced Scorecard system, KPIs, targets, and a full Canadian resource directory. 31 pages. Free download.
Prepared by Foodie Run Hospitality Management · Compiled July 2026
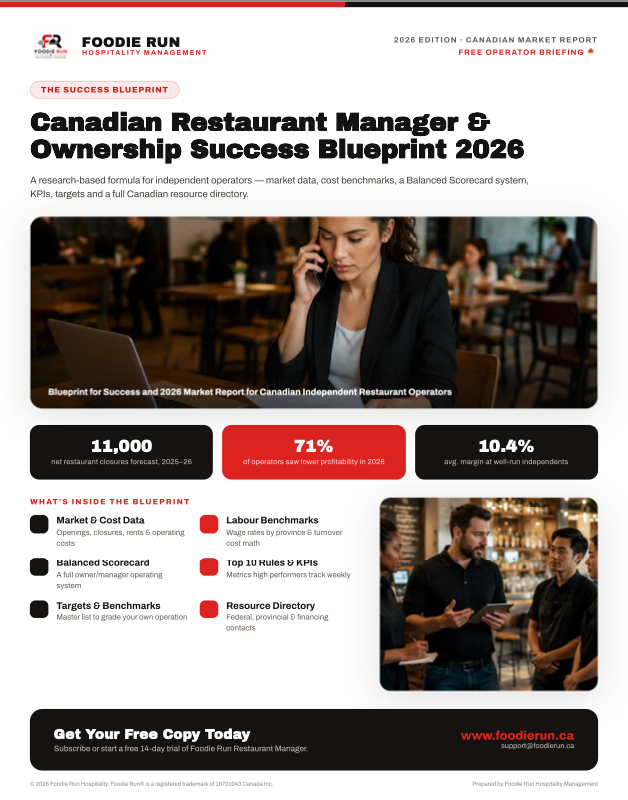
Net restaurant closures forecast 2025–26
Of operators saw lower profitability in 2026
Avg. margin at well-run independents
Of food-service businesses at a loss or break-even
31 pages of research-backed data, frameworks, and actionable tools compiled specifically for Canadian independent restaurant operators.
Openings, closures, rents & operating costs across Canada 2021–2026.
A full owner/manager operating system with 4 perspectives.
Wage rates by province & turnover cost math.
Metrics high performers track weekly to stay profitable.
Master list to grade your own operation against the best.
Federal, provincial & financing contacts across Canada.
The numbers every Canadian independent operator needs to know — and hit — in 2026.
The Restaurant Success Formula
Weakness in any ONE factor reduces overall profitability — the formula is multiplicative, not additive.
Industry data shows ~60% fail in year one, ~80% within 3–5 years. The causes are consistent — and preventable.
Source: industry failure analysis data compiled in the Blueprint · All causes are covered with solutions in the report.
Dalhousie University's Agri-Food Analytics Lab forecasts ~7,000 restaurant closures in 2025, with a further 4,000 expected in 2026 — up to 11,000 establishments in two years. This is not a demand collapse. It's the delayed unwinding of pandemic-era supports that masked an unsustainable cost structure.
At the same time, well-run independent restaurants are still thriving. TouchBistro's 2026 report found independents posting average 10.4% margins, with 79% seeing increased visits. The difference is the rigour of the operating system — not the quality of the food.
This Blueprint gives you that operating system, free.
Financial — Are we sustainably profitable?
Prime cost · Net margin · Occupancy % · Cash reserve
Customer — Are guests coming back & telling others?
Traffic · Avg. cheque · Reviews · Loyalty rate
Internal Process — Are our operations efficient & consistent?
Waste % · Table turns · Inventory variance
Learning & Growth — Is our team & system improving?
Staff turnover · Training hrs · Tech integration
Subscribe to our mailing list and download the full 31-page Blueprint instantly.