How to Calculate Food Cost Percentage for Your Canadian Restaurant: 2026 Guide
Learn how to calculate food cost percentage for your Canadian restaurant with step-by-step formulas, COGS calculation, benchmarks by cuisine type, and practical strategies to reduce food costs in 2026.

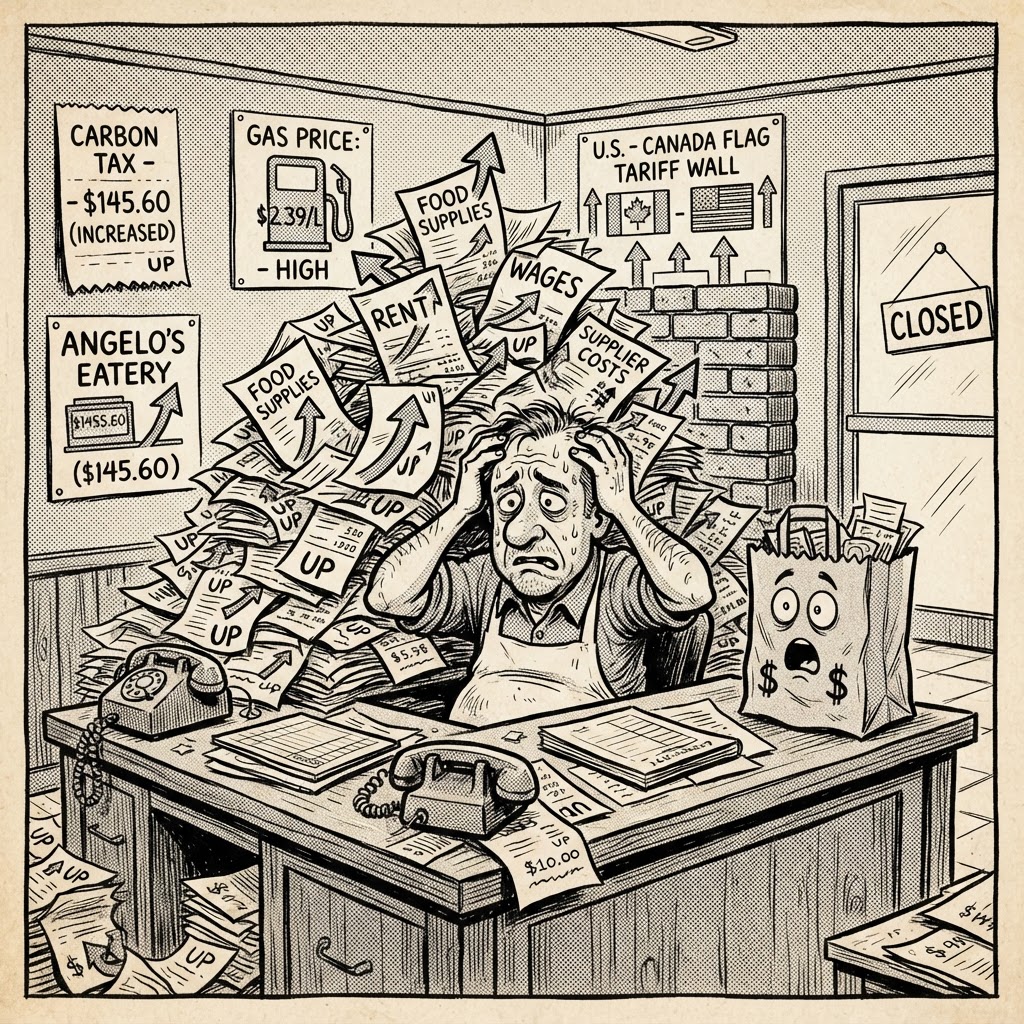
If you run a restaurant in Canada, food cost percentage is the single most important number you need to track — and most operators are calculating it wrong.
Canada's Food Price Report 2026 (Dalhousie University) forecasts food prices will rise 4-6% this year. The National Restaurant Association reports that food costs have risen 34% above pre-pandemic levels. Meanwhile, 41% of Canadian restaurants are operating at a loss or barely breaking even (Restaurants Canada, 2025).
When ingredient costs are climbing this fast, you can't afford to guess. You need to know your food cost percentage — to the decimal point — every single week.
In this guide, we'll walk through exactly how to calculate food cost percentage, what the benchmarks are for Canadian restaurants by cuisine type, and what to do when your numbers are too high.
What Is Food Cost Percentage?
Food cost percentage measures how much of your food sales revenue goes toward purchasing ingredients. It's the ratio of what you spent on food to what you earned selling it.
Food Cost % = (Cost of Goods Sold ÷ Food Sales) × 100
A food cost percentage of 30% means that for every $100 in food sales, you spent approximately $30 on ingredients. The remaining $70 covers labour, rent, utilities, and (hopefully) profit.
How to Calculate COGS (Cost of Goods Sold)
Before you can calculate food cost percentage, you need to know your COGS. This is the actual cost of the food you used during a specific period — not what you purchased, but what you consumed.
COGS = Beginning Inventory + Purchases − Ending Inventory
Step-by-Step Example
Let's say you run a full-service restaurant in Toronto. Here's your data for the month:
- Beginning inventory (value of all food on hand at the start of the month): $5,000
- Purchases (all food deliveries during the month): $18,000
- Ending inventory (value of all food remaining at month-end): $4,000
- Food sales for the month: $60,000
COGS = $5,000 + $18,000 − $4,000 = $19,000
Food Cost % = ($19,000 ÷ $60,000) × 100 = 31.7%
At 31.7%, this restaurant is within the healthy range for a full-service casual dining concept (28-35%). But if the number were 38%, that would signal a problem.
Canadian Food Cost Benchmarks by Concept (2026)
Food cost targets vary significantly by restaurant type. Here are the current Canadian benchmarks:
Restaurant Concept Target Food Cost % Upper Limit Quick-Service / Fast-Casual 25–30% 32% Café / Bakery 25–30% 32% Full-Service Casual Dining 28–35% 37% Italian / Pizza 25–32% 35% Steakhouse / Fine Dining 35–42% 45% Bar / Pub (food) 28–35% 38% Sources: VantaInsights, Rezku, Restaurant Inventory Tools, CustomCPA (2026)
Steakhouses naturally have higher food costs because protein is expensive. Quick-service restaurants have lower food costs because they benefit from volume purchasing and simpler menus. Know your benchmark before you panic.
Per-Item Food Cost: Pricing Your Menu Correctly
Beyond the overall percentage, you should calculate food cost for each menu item:
Item Food Cost % = (Ingredient Cost ÷ Menu Price) × 100
For example, if your butter chicken costs $6.50 in ingredients and sells for $21.95:
$6.50 ÷ $21.95 × 100 = 29.6%
That's within a healthy range. But if your burger costs $8.50 in ingredients and sells for $16.95:
$8.50 ÷ $16.95 × 100 = 50.1%
That's a problem. You're spending half your revenue on the ingredients alone, leaving almost nothing for labour, overhead, and profit.
How to Price a Menu Item
Start with your ingredient cost and your target food cost percentage:
Menu Price = Ingredient Cost ÷ Target Food Cost %
If your ingredient cost is $6.50 and your target food cost is 30%:
$6.50 ÷ 0.30 = $21.67
Round to $21.95 or $22.00 — competitive and profitable.
5 Signs Your Food Cost Is Too High
- Inventory shrinkage. Your COGS calculation shows more food "used" than you should have sold. This signals theft, over-portioning, or untracked wastage.
- Supplier prices crept up. You haven't renegotiated with suppliers in 6+ months. Food prices rose 4-6% in 2026 — if your menu prices haven't adjusted, your margins are shrinking.
- Portion inconsistency. Two cooks making the same dish with different portion sizes. Standardize recipes with exact measurements.
- High-waste items. Certain ingredients spoil before they're used. Track which items are thrown away most frequently.
- No menu engineering. You haven't classified your menu items as Stars, Plowhorses, Puzzles, or Dogs. A Cornell University study found restaurants that ran menu engineering properly added roughly 10% to profit without changing a single recipe.
How to Reduce Food Cost Without Sacrificing Quality
1. Conduct Weekly Inventory Counts
Most independent restaurants do a monthly walk-through and guess. That's an autopsy, not a health check. Weekly counts catch wastage, over-ordering, and theft before they compound. Focus on high-value, high-rotation items first — proteins, dairy, and fresh produce.
2. Engineer Your Menu
Classify every item by profitability and popularity:
- Stars (high profit, high popularity) → Feature prominently, protect recipe
- Plowhorses (low profit, high popularity) → Slightly raise price or reduce portion
- Puzzles (high profit, low popularity) → Market harder or reposition on menu
- Dogs (low profit, low popularity) → Remove from menu
3. Track Wastage Daily
Every spoiled ingredient, burned dish, and over-portioned plate is money lost. Studies show restaurants can reduce food waste by 20-30% with proper inventory management (Bonappify, 2026). Log wastage daily — even a simple note on your phone works. Look for patterns: same ingredient spoiling each week? Reduce your order size.
4. Renegotiate with Suppliers
Canadian food distributors operate on margins too. If you've been a loyal customer for 12+ months, ask for volume discounts. Compare prices across 2-3 suppliers quarterly. Join a group purchasing organization (GPO) if you're a smaller operator — collective buying power reduces per-unit costs.
5. Trim Your Menu by 20-30%
Removing items that sell fewer than 5 times per week, have food costs above 35%, or require unique ingredients creates immediate savings: less waste, faster ticket times, easier staff training, and better consistency. Every item on your menu should earn its place.
6. Standardize Recipes and Portions
If two cooks make the same dish differently, your food cost is inconsistent. Use standardized recipes with exact measurements, portion scoops, and visual guides. Train every new hire on the same specs.
The Impact of Canada's 2026 Food Price Increases
Canada's Food Price Report 2026 forecasts:
- Meat prices: +4-6% (biggest driver of restaurant cost increases)
- Vegetables: +3-5%
- Dairy: +2-4%
- Bakery: +3-5%
If your food cost was 32% last year and ingredient prices rose 5%, your food cost is now effectively 33.6% — unless you've adjusted menu prices or reduced portions. That 1.6 percentage point difference on $500,000 in annual food sales is $8,000 in lost profit.
How to Track Food Cost Without Spreadsheets
Most independent restaurant owners know they should track food cost weekly. But building spreadsheets, counting inventory manually, and calculating ratios takes hours they don't have.
Foodie Run automates the entire process:
- Enter beginning and ending inventory values — takes 5 minutes
- System automatically calculates COGS and food cost %
- Compare against benchmarks for your specific concept type
- Track food cost trends day-by-day and week-by-week
- Generate professional P&L reports with food cost breakdown
- Log wastage in seconds from your phone
- Track menu items with per-item food cost calculations
All for $19.99/month or $199/year. Built in Canada, priced in CAD.
Quick-Reference: Food Cost Formula Card
Metric Formula COGS Beginning Inventory + Purchases − Ending Inventory Food Cost % (COGS ÷ Food Sales) × 100 Per-Item Food Cost % (Ingredient Cost ÷ Menu Price) × 100 Target Menu Price Ingredient Cost ÷ Target Food Cost % The Bottom Line
In 2026, food prices are rising, margins are thin, and 41% of Canadian restaurants are losing money. The operators who survive will be the ones who know their food cost percentage to the decimal point — and adjust before a problem compounds.
Calculate your food cost this week. If it's above your benchmark, start with menu engineering and weekly inventory counts. And if spreadsheets are eating your time, try a system that does the math for you.
Ready to see your numbers clearly?
🎁 Start a free 14-day trial of Foodie Run — no credit card required. Use code BLUEPRINT25 for 25% off.
Download our free 2026 Success Blueprint for the complete financial framework.
Foodie Run is a Canadian-built restaurant management platform for independent operators. Built by 16701043 Canada Inc. Priced in CAD. PIPEDA-compliant. $19.99/month or $199/year.
Sources: Canada's Food Price Report 2026 (Dalhousie University / University of Guelph), Restaurants Canada, National Restaurant Association 2026 State of the Industry Report, VantaInsights, Rezku, Restaurant Inventory Tools, CustomCPA, Cornell University School of Hotel Administration, Bonappify Food Waste Reduction Guide 2026.
Take control of your restaurant's numbers
Foodie Run brings prime cost, labour, forecasting, and reporting into one Canadian-built platform.
Start your 14-day free trial